监控概述
什么是监控
监控是整个运维乃至整个产品生命周期中最重要的一环,事前及时预警发现故障,事后提供详实的数据用于追查定位问题。
目前业界有很多不错的开源产品可供选择。选择一款开源的监控系统,是一个省时省力、效率最高的方案。当然,对监控不是很明白的朋友们,看了以下文章可能会对监控整个体系有比较深刻的认识。
为什么做监控
监控怎么做
初识Prometheus
历史
起源:Prometheus项目最初由SoundCloud的工程师团队于2012年开始开发。
开源发布:2015年,Prometheus首次作为开源项目发布,并迅速获得了广泛的关注和采用。Prometheus的开源模型吸引了全球开发者社区的参与和贡献,使得项目得以快速发展和改进。
CNCF孵化:2016年,Prometheus加入了云原生计算基金会(CNCF),成为其维护的项目之一。
CNCF毕业:2018 年 ,云原生计算基金会(CNCF)宣布开源监控工具Prometheus已从孵化状态进入毕业状态。要到达这一评级,一个项目必须展示其增长,文档、有组织的治理流程、对社区可持续性和包容性的承诺。
架构图
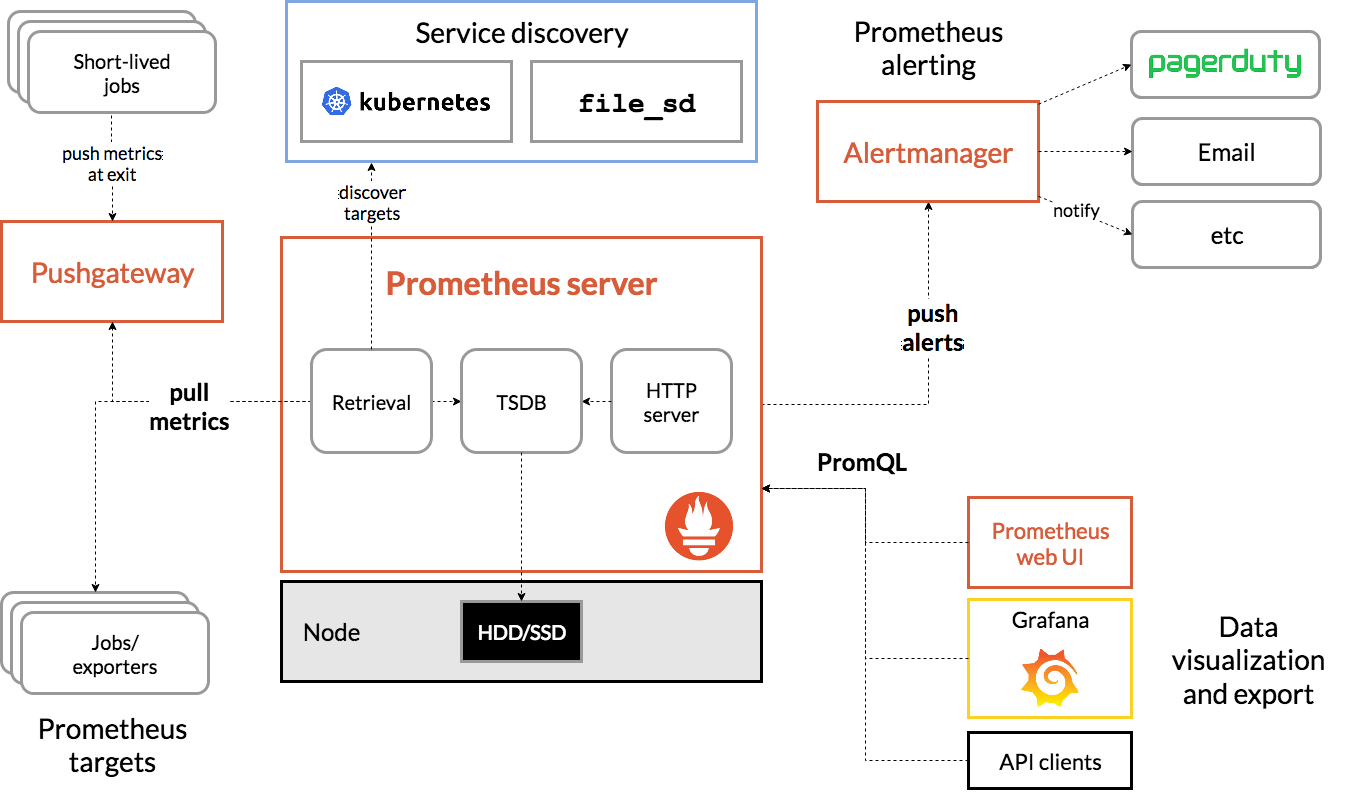
组件
Prometheus server:Prometheus组件中的核心部分,负责实现对监控数据的获取,存储以及查询。
Exporter:将被监控的服务的数据通过HTTP服务的形式暴露给Prometheus Server。
Alertnamager:如果满足定义的告警规则被触发,就会产生一条告警,AlertManager用户管理后续的告警流程,如告警渠道,告警抑制与静默等。
Pushgateway:由于Prometheus数据采集基于Pull模型进行设计,因此在网络环境的配置上必须要让Prometheus Server能够直接与Exporter进行通信。 当这种网络需求无法直接满足时,就可以利用PushGateway来进行中转。
优缺点
优点
-
部署极为简单且组建较少,大大缩短监控部署时间。
-
天生支持容器监控。
-
周边插件非常丰富,大量的
exporter拿来即用。 -
大量的服务开始原生支持
Prometheus,如Apollo/RabbitMQ等。 -
采用时序型数据库,查询快人一步。
-
开源且社区活跃,
bug修复快。 -
非常方便地在应用程序中进行集成,研发同学可讲自己的应用程序纳入到
Prometheus监控中。 -
结合
Grafana出图美观,汇报首选。
不足
- 中文文档匮乏,自学成本高。
- 监控数据需要通过数学计算得出,少数时候需要自己研究指标含义及修改数学计算公式。
- 对集群支持较差。
Prometheu部署
快速部署
Prometheus下载地址为https://prometheus.io/download/。
|
|
解压Prometheus安装包。
|
|
创建用户,用于运行Prometheus。
|
|
配置systemd。
|
|
启动服务,并加入开机自启。
|
|
prometheus 使用的是 9090 端口。
|
|
通过浏览器访问Prometheus,我看可查看监控。如我们可以一下语句查询healthy接口被请求的次数。
|
|
初识配置文件
我们是如何获取到Prometheus相关的监控数据的呢?
在启动Promethues的时候,我们指定了配置文件的路径。我们一起来看看配置文件的内容。
|
|
Prometheus采集精度可以精确到1-5秒,提升监控的精细程度。但是过于频繁的采集,会带来存储成本的增加及性能瓶颈。
根据以上配置文件,Prometheus会每隔15s去请求一次http://localhost:9090/metrics。
认识metrics
metric通常由指标名称metric name和标签label组成,格式如下:
|
|
其中prometheus_http_requests_total为指标名称,其中{}为标签。
|
|
metrics类型
Prometheus客户库提供了四个核心的metrics类型。
Counter(计数器)
Counter是一种累积指标,它的值随着时间的推移,只会单调递增。当重启时,它的值重置为零。
例如,您可以使用counter来表示所服务的请求数、已完成的任务数或错误数。上述prometheus_http_requests_total就是counter类型。
不要使用计数器来暴露可能减小的值。 例如,不要使用计数器来计算当前正在运行的进程数。
Gauge(测量器)
Gauge可以表示任意上升和下降的单个数值。
例如:可以使用Gauge来表示当内存使用情况等,但也用于可上下的“计数”,例如并发请求数。
Histogram(柱状图)
Histogram是柱状图,表示对目标请求持续的时间或目标响应的大小进行采样,并将它们计数到可配置的存储桶(bucket)中。 有如下作用:
-
对每个采样点进行统计,打到各个分类值中(
bucket)。 -
对每个采样点值累计和(
sum)。 -
对采样点的次数累计和(
count)。
Summary采样点分位图
类似于Histogram,有如下作用:
-
对于每个采样点进行统计,并形成分位图。(如:正态分布一样,统计低于
60分不及格的同学比例,统计低于80分的同学比例,统计低于95分的同学比例。) -
统计班上所有同学的总成绩(
sum)。 -
统计班上同学的考试总人数(
count)。
自动化生成的标签
当Prometheus抓取目标时,它会自动在抓取的时间序列上附加一些标签,用于表示抓取的目标。
- job: 目标所属的配置任务名称。
- instance: 采样点所在服务:
host:port。
如果以上两个标签二者之一存在于采样点中,这个取决于honor_labels配置选项。
对于每个instance,Prometheus还会增加以下metric。
up{job="[job-name]", instance="instance-id"}: up值=1,表示采样点所在服务健康; 否则,网络不通, 或者服务挂掉了scrape_duration_seconds{job="[job-name]", instance="[instance-id]"}: 尝试获取目前采样点的时间开销。scrape_samples_post_metric_relabeling{job="", instance=""}: 表示度量指标的标签变化后,标签没有变化的度量指标数量。scrape_samples_scraped{job="", instance=""}: 这个采样点目标暴露的样本点数量。
up是一个非常重要的指标,可通过up的状态判断服务是否健康。
主机监控
我们可以通过node_exporter从主机上抓取系统级别的指标数据。如CPU/内存/磁盘等。
下载并解压node_exporter。
|
|
配置启动文件。
|
|
启动服务。
|
|
检查监听的端口。
|
|
修改Prometheus配置,添加如下内容。
|
|
平滑重启。
consul
|
|
PromQL
数据可视化Grafana
Grafana是一个开源的数据可视化和监控平台。它提供了一个功能强大的仪表板和图表编辑器,可以将各种数据源的数据进行可视化展示,帮助用户实时监控和分析数据。
除了数据可视化外,Grafana还提供了强大的告警功能,用户可以设置条件和阈值,当监控指标超出预设的范围时,系统会发送警报通知。这使得用户可以及时发现和解决潜在的问题,保证系统的稳定性和可靠性。
下载及安装
可到Grafana官网下载,OSS为社区版,可免费使用。
|
|
启动服务。
|
|
grafana默认监听在3000端口上。
|
|
浏览器通过IP:Port的方式可访问grafana。
默认的用户名和密码均为admin,登录成功后,需要修改密码。
添加数据源

出图
出图
导入
在 https://grafana.com/grafana/dashboards?dataSource=prometheus 找到合适的模板并导入
集成ldap
权限控制
告警AlertManager
部署与配置
告警状态
分组
抑制
静默
一些经验
Push gateway
自动化监控
基于文件的服务发现
基于consul的服务发现
数百台主机接入监控
其他应用监控
进程监控
Nginx监控
LDAP监控
MySQL监控
jvm监控
windows监控
2.4 CPU使用的百分比
increase(node_cpu_seconds_total{mode="idle"}[1m])
increase(node_cpu_seconds_total[1m])
通过 metrics 我们可看出 node_cpu_seconds_total 数据类型为 counter
# TYPE node_cpu_seconds_total counter
node_cpu_seconds_total{cpu="0",mode="idle"} 27710.33
......
取值思路
1 - ( idle时间 / cpu占用总时间 )
取出 idle 占用的时间
node_cpu_seconds_total{mode="idle"}
取出 1min 内增加的 idle 占用的时间
increase(node_cpu_seconds_total{mode="idle"}[1m])

由于 cpu 是多核心的,可通过 sum 函数对结果进行聚合,但是会将不同的服务器不同的核心全都聚合成一条线
sum(increase(node_cpu_seconds_total{mode="idle"}[1m]))
通过 sum 配合 by 可根据不同类型的数据进行聚合
sum(increase(node_cpu_seconds_total{mode="idle"}[1m]))by(instance)

通过上述推算,我们可得
cpu 在 1min 内空闲的时间
sum(increase(node_cpu_seconds_total{mode="idle"}[1m]))by(instance)
cpu 在 1min 内总的时间
sum(increase(node_cpu_seconds_total[1m]))by(instance)
空闲时间占总时间的比值
sum(increase(node_cpu_seconds_total{mode="idle"}[1m]))by(instance)/sum(increase(node_cpu_seconds_total[1m]))by(instance)
CPU的使用率
(1-sum(increase(node_cpu_seconds_total{mode="idle"}[1m]))by(instance)/sum(increase(node_cpu_seconds_total[1m]))by(instance))*100

同理,cpu 的 io 时间百分比可通过以下公式获得
sum(increase(node_cpu_seconds_total{mode="iowait"}[1m]))by(instance)/sum(increase(node_cpu_seconds_total[1m]))by(instance)*100
2.5 基于文件的目标发现
通过编辑 prometheus.yml 可实现对节点的监控
  - job_name: 'node-exporter'
    static_configs:
    - targets: ['192.168.199.206:9100','192.168.199.207:9100']
也可以基于文件自动发现的方式实现此功能,修改 prometheus.yml 配置文件
  - job_name: 'node-exporter'
    file_sd_configs:
    - files: ['targets/*.json']
      refresh_interval: 5s
根据文件目录新建文件,若是通过 Docker 方式启动,需要注意配置文件的路径
/etc/prometheus $ cat targets/node-exporter.json
[{
  "targets": [
    "192.168.199.206:9100",
    "192.168.199.207:9100"
  ],
  "labels": {
    "datacenter":"NanJing"
  }
}]
重启启动 Prometheus 后,可以发现目标主机已经被发现

也可基于 DNS 实现目标发现