安装elasticsearch_exporter
公司内部有elasticsearch集群,针对es集群可通过elasticsearch_exporter监控。
在一台可以连接es集群的主机上下载并安装elasticsearch_exporter。
1
2
3
4
|
cd /usr/local/src/
wget https://github.com/prometheus-community/elasticsearch_exporter/releases/download/v1.6.0/elasticsearch_exporter-1.6.0.linux-amd64.tar.gz
tar xf elasticsearch_exporter-1.6.0.linux-amd64.tar.gz -C /opt/
ln -s /opt/elasticsearch_exporter-1.6.0.linux-amd64/ /opt/elasticsearch_exporter
|
服务启动
常用启动参数。
--es.uri             默认http://localhost:9200,连接到的Elasticsearch节点的地址(主机和端口)。 这可以是本地节点(例如localhost:9200),也可以是远程Elasticsearch服务器的地址
--es.all                默认flase,如果为true,则查询群集中所有节点的统计信息,而不仅仅是查询我们连接到的节点。
--es.cluster_settings   默认flase,如果为true,请在统计信息中查询集群设置
--es.indices            默认flase,如果为true,则查询统计信息以获取集群中的所有索引。
--es.indices_settings   默认flase,如果为true,则查询集群中所有索引的设置统计信息。
--es.shards             默认flase,如果为true,则查询集群中所有索引的统计信息,包括分片级统计信息(意味着es.indices = true)。
--es.snapshots          默认flase,如果为true,则查询集群快照的统计信息。
配置systemd。
 1
 2
 3
 4
 5
 6
 7
 8
 9
10
11
12
13
14
15
16
17
18
19
|
cat /etc/systemd/system/elasticsearch_exporter.service
[Unit]
Description=elasticsearch_exporter
After=local-fs.target network-online.target network.target

[Service]
Type=simple
ExecStart=/opt/elasticsearch_exporter/elasticsearch_exporter \
	--es.all --es.indices --es.shards \
	--es.indices_settings --es.snapshots \
	--es.timeout=10s --web.listen-address=0.0.0.0:9114 \
	--web.telemetry-path=/metrics \
	--es.uri http://elastic:0pxxxxxxx@10.66.3.123:9200
ExecReload=/bin/kill -HUP $MAINPID
KillMode=process
Restart=on-failure

[Install]
WantedBy=multi-user.target
|
启动服务。
1
2
3
4
|
systemctl daemon-reload
systemctl enable elasticsearch_exporter
systemctl start elasticsearch_exporter
systemctl status elasticsearch_exporter
|
Prometheus
配置Prometheus,targets为elasticsearch_exporter的连接地址。
1
2
3
|
- job_name: 'elasticsearch'
  static_configs:
  - targets: ['10.66.0.61:9114']
|
告警规则。
 1
 2
 3
 4
 5
 6
 7
 8
 9
10
11
12
13
14
15
16
|
- alert: ElasticsearchTooFewNodesRunning
  expr: elasticsearch_cluster_health_number_of_nodes < 3
  for: 5m
  labels:
    severity: critical
  annotations:
    summary: "Elasticsearch running on less than 3 nodes"
    description: "There are only {{$value}} < 3 Elasticsearch nodes running"
- alert: ElasticsearchHeapTooHigh
  expr: elasticsearch_jvm_memory_used_bytes{area="heap"} / elasticsearch_jvm_memory_max_bytes{area="heap"} > 0.9
  for: 15m
  labels:
    severity: critical
  annotations:
    summary: "Elasticsearch node {{$labels.instance}} heap usage is high"
    description: "The heap usage is over 90% for 15m"
|
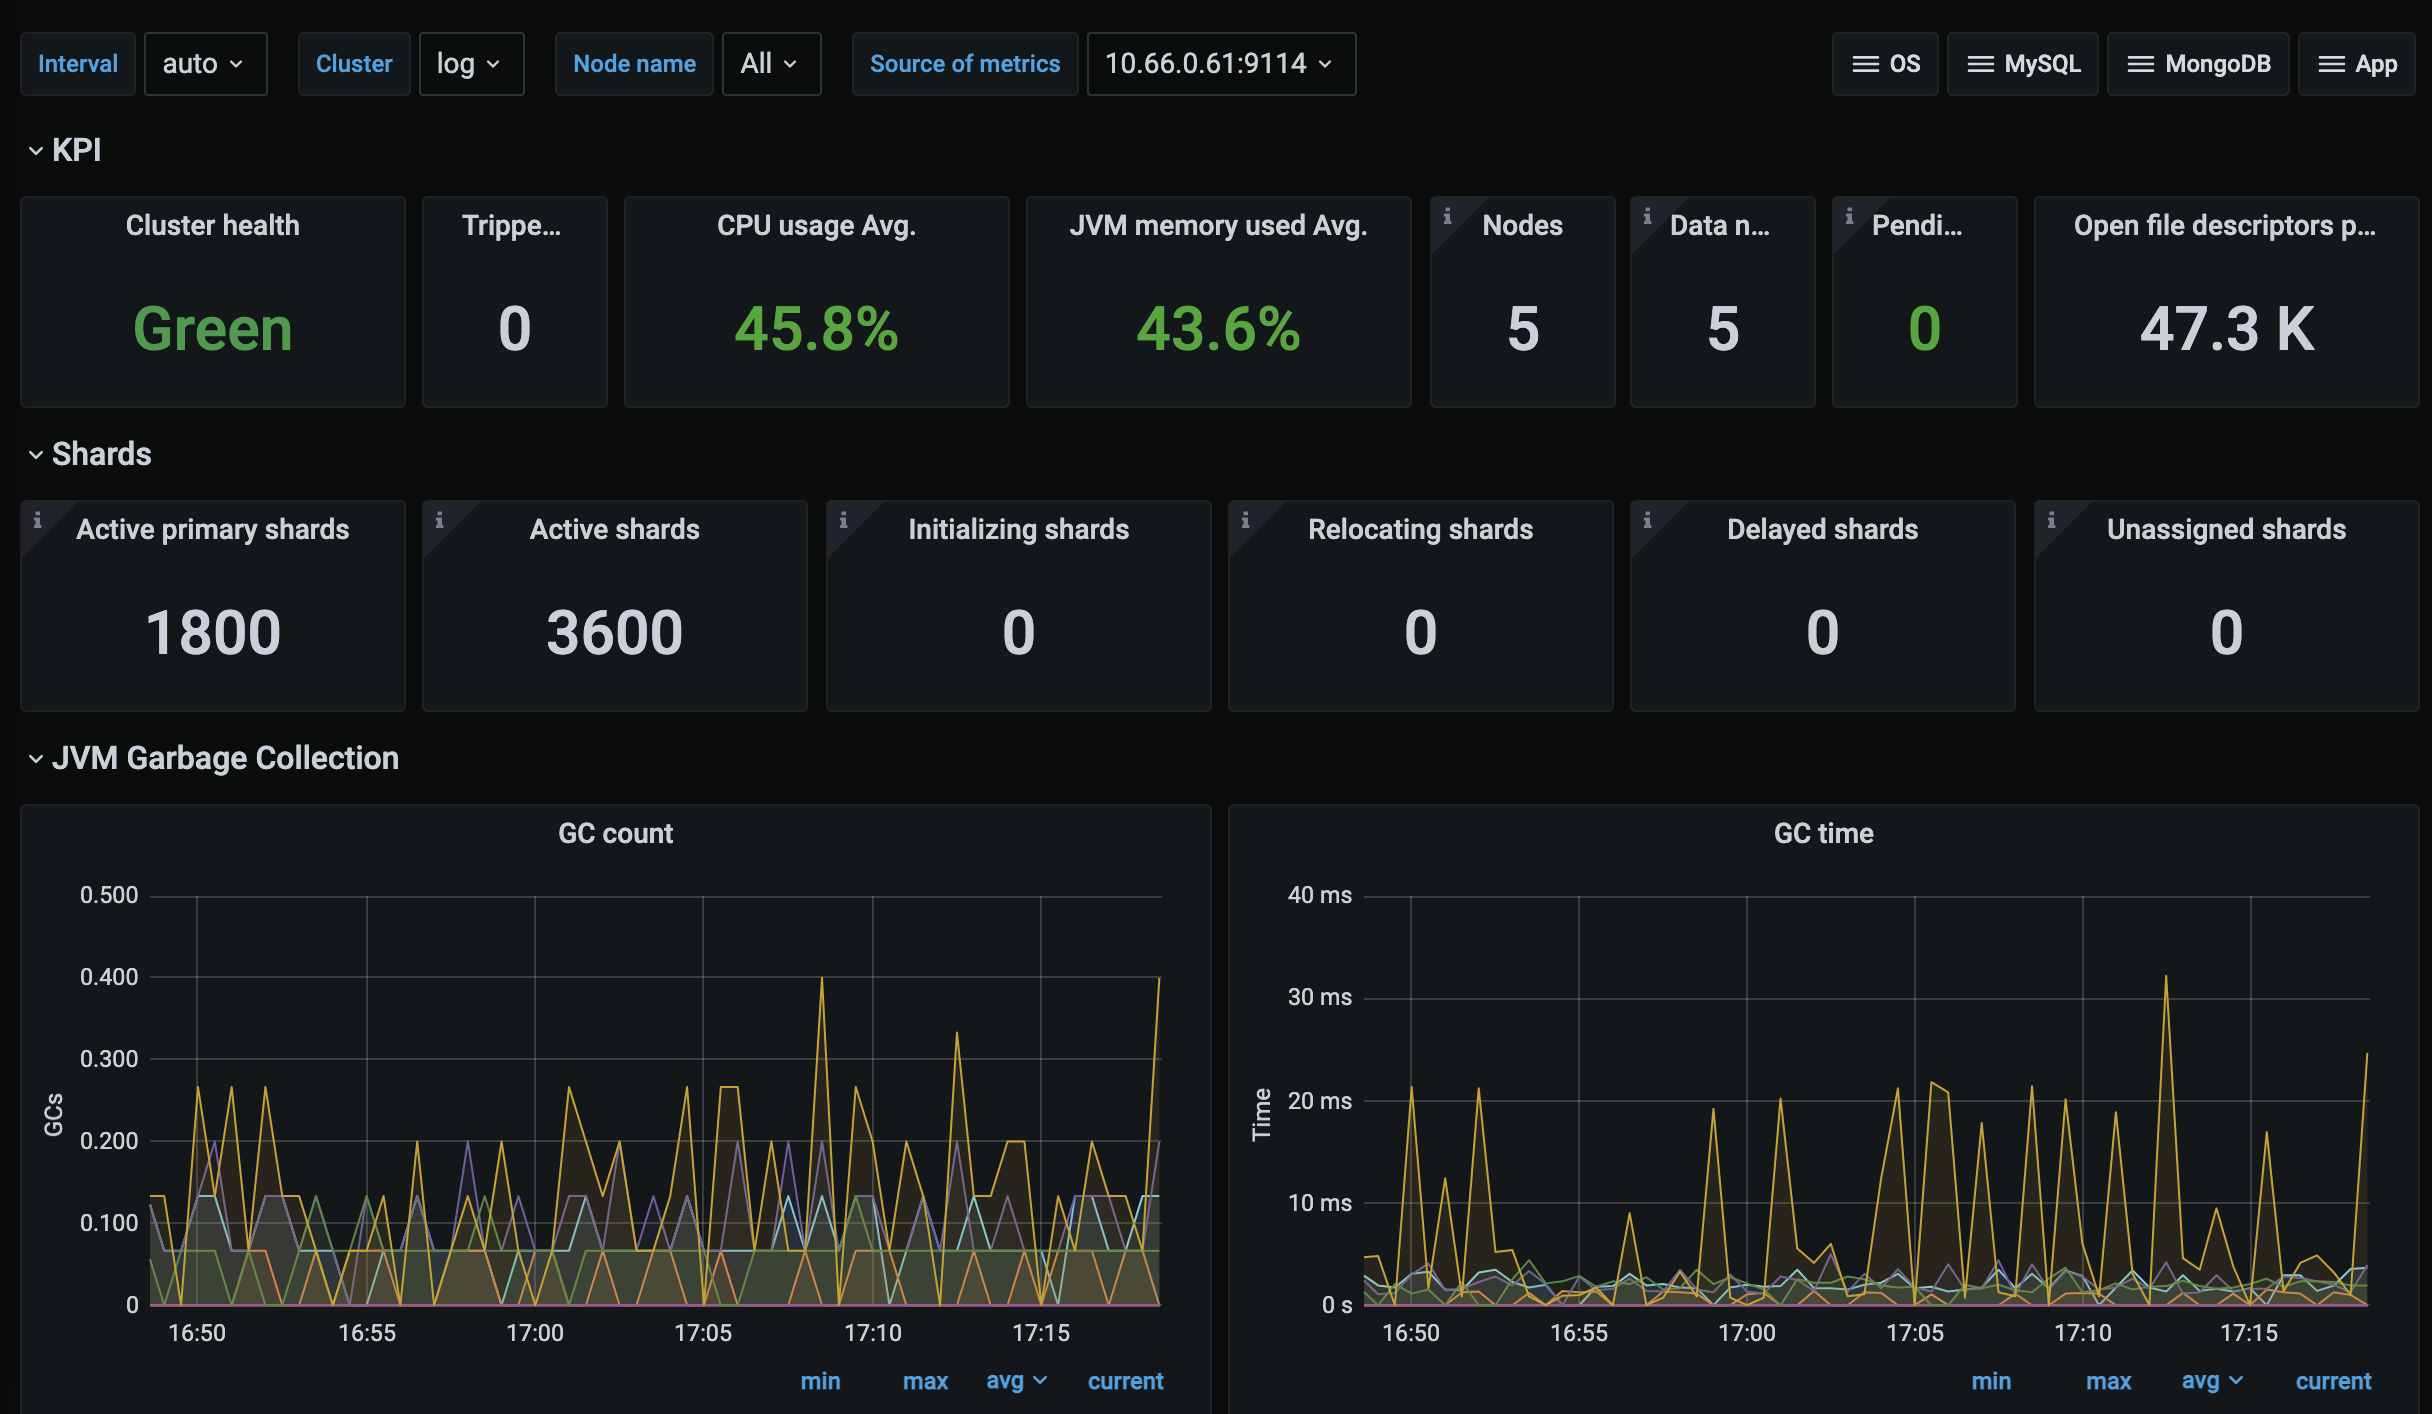
Grafana
导入Grafana模版2322,效果如图。